Survey Reports
Reports Filter
By clicking on the reports icon, the Advanced Filter is displayed from the Survey module, where you can select:
Date Range: Period of time for the results evaluation of the quality survey.
Campaigns: The campaign involved in the survey.
Agents: The agents that are audited from the survey.
Groups: The groups of agents that are audited from the survey.
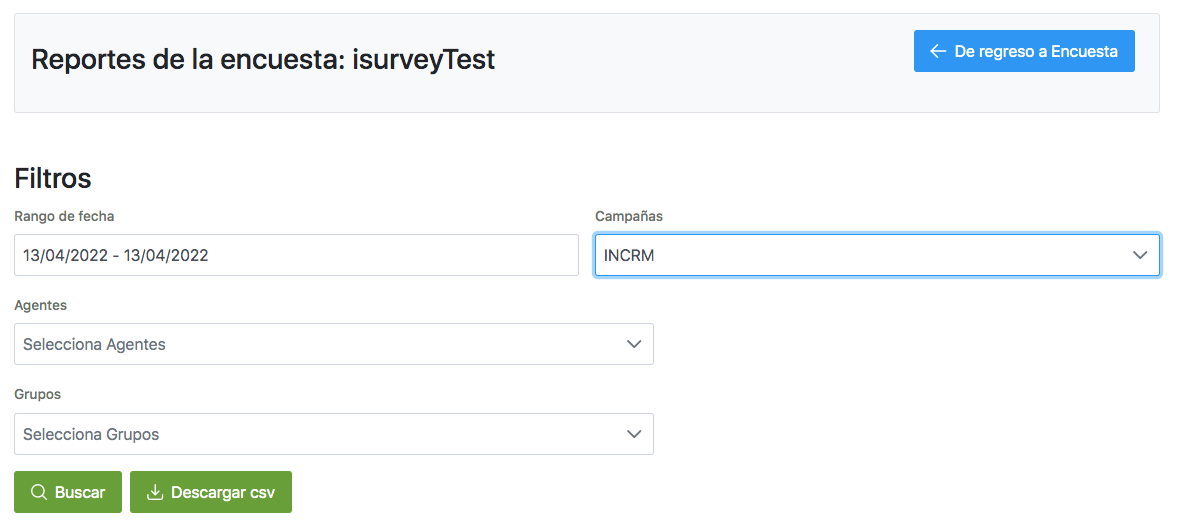
By pressing the “Search” button, the multiple results related to the survey are displayed. On the other hand the button “Download CSV” allow us to obtain a file in CSV/Excel format from which a record sheet / CSV file is obtained with all the call transactions and recording audio paths associated. The survey options selected by caller are also shown for each of the survey sections.
Report Results
A la hora de evaluar los reportes de encuestas, partimos de una serie de Tabs que organizan la información en diferentes secciones:
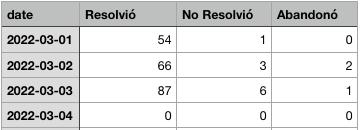
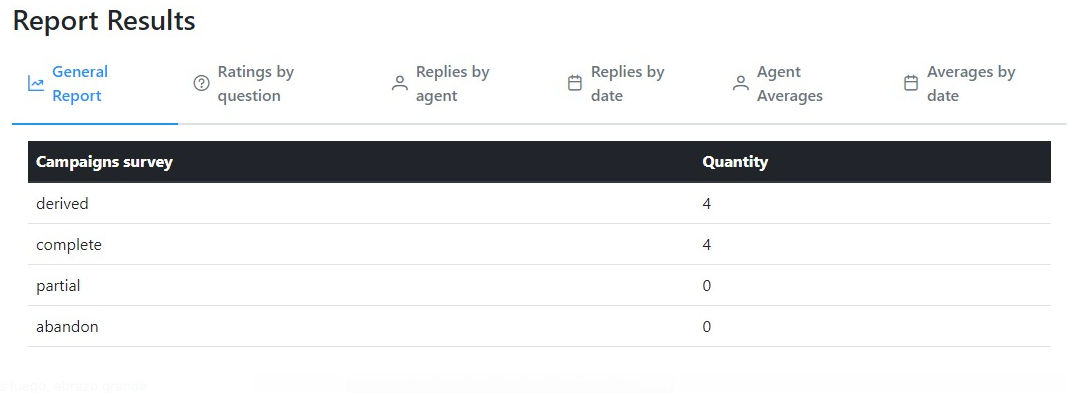
Reporte General: ofrece cantidades de llamadas derivadas a encuesta, completadas, parcialmente completadas y abandonadas durante la reproducción de los audios asociados.
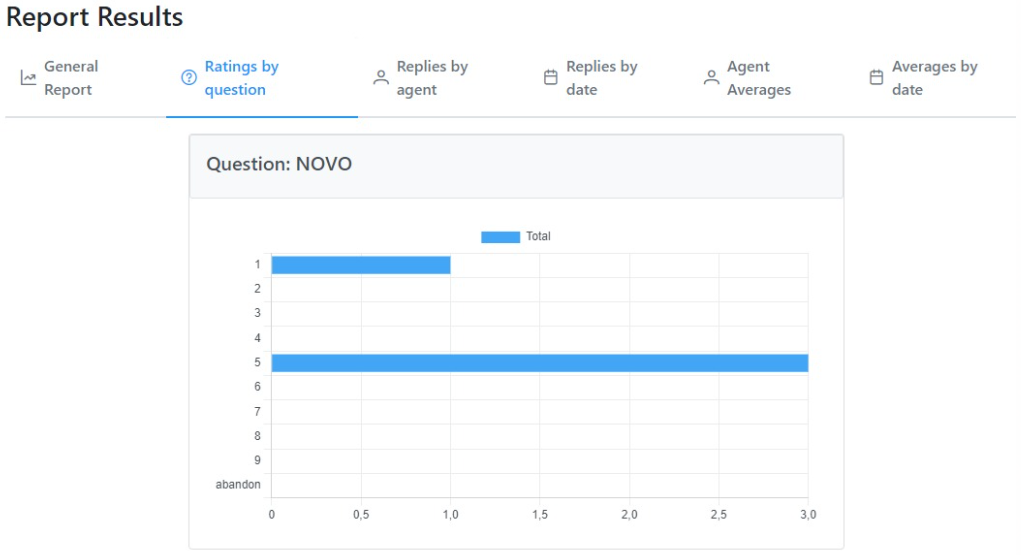
Ratings by Question: for each question in the survey, the different ratings made by the caller at the time of answering the survey.
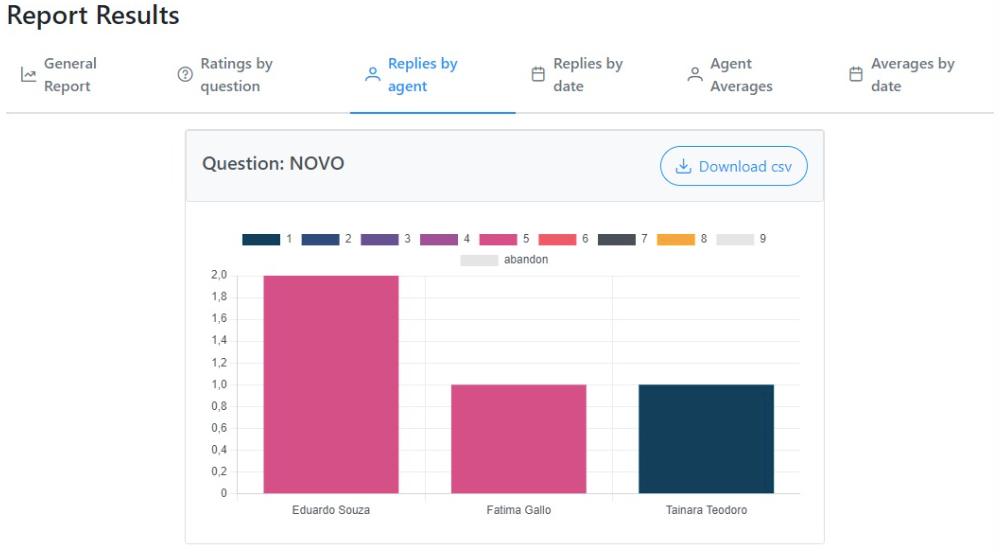
Answers by Agent: for each question of the survey, the different options selected by the caller are plotted, for agent.
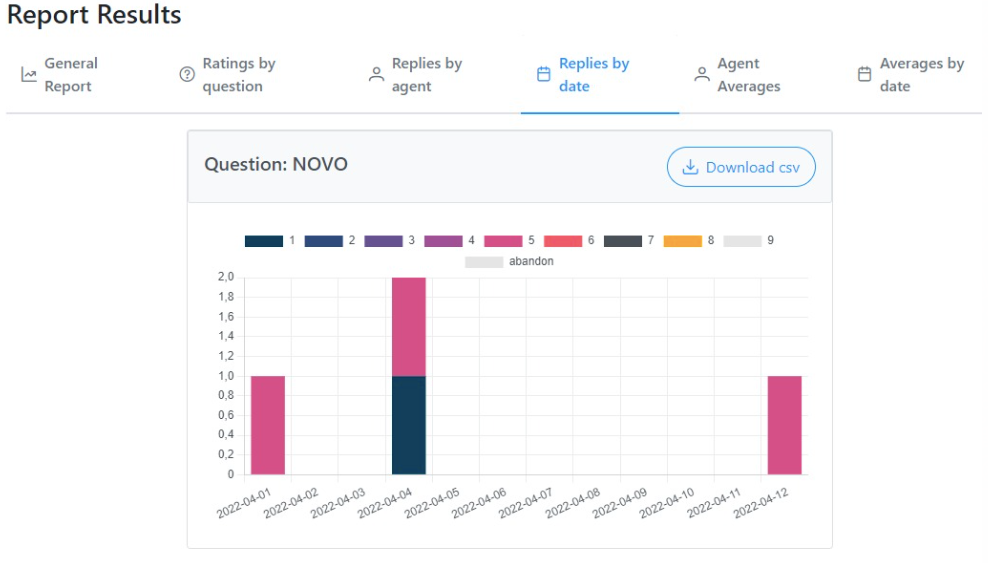
Answers by Date: for each question of the survey, the different options selected by the caller are displayed, by date.
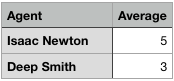
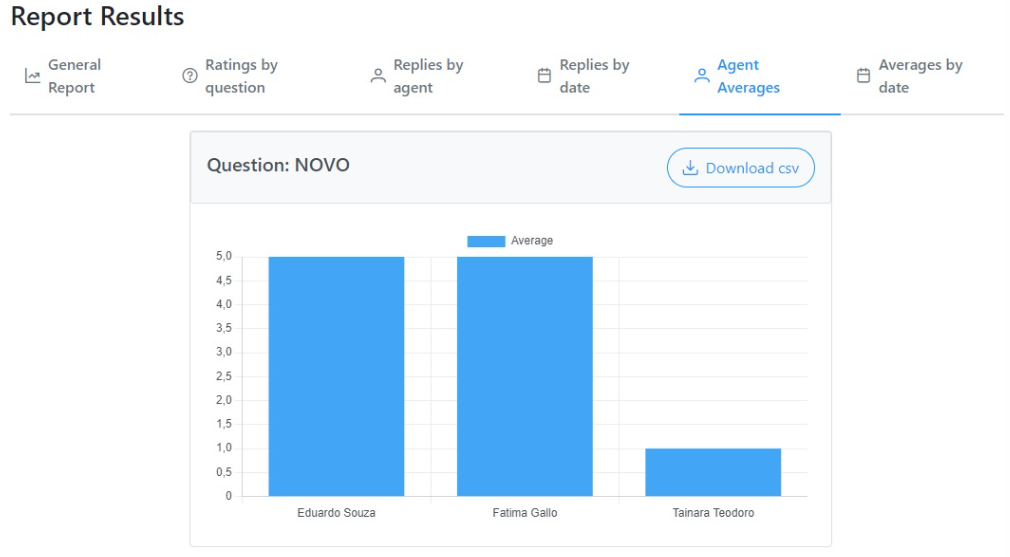
Averages by Agent: for each “weighted” question, the average of the options selected by the caller, per agent.
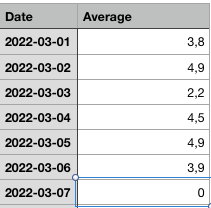
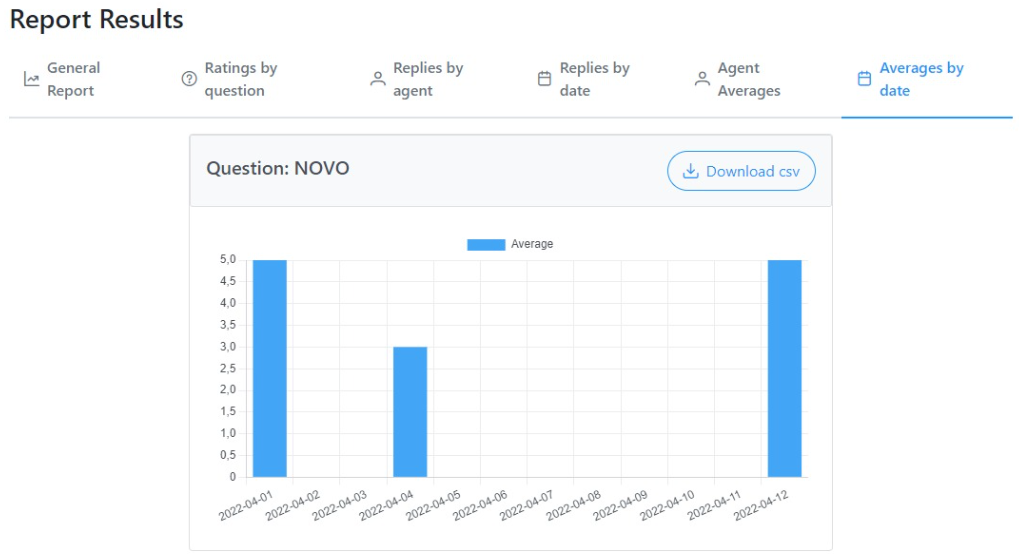
Promedios por Fecha: para cada pregunta “ponderada”, se obtiene el promedio de las opciones seleccionadas por el llamante, por dia.
It is important to mention that all of the report sections presented in the different views and graphs, are exportable to CSV/EXcel for a correct analysis.